Since the financial crisis and ensuing Great Recession, we’ve all become accustomed to the increasingly active role that politicians (and central banks) have taken in managing economic and market outcomes. For today’s investors, political risk has become a near-constant phenomenon, an integral part of the market’s ongoing background noise. And yet, even against that backdrop, this year’s U.S. presidential election stands out as a particularly nerve-racking event.
Not surprisingly, breathless headlines abound. On one side, the uncertainty associated with a potentially volatile Donald Trump presidency has yielded predictions of steep stock market losses of 20% or more. Not to be outdone, Trump’s supporters have gone so far as to predict that “Hillary Clinton will destroy the whole world” if she is elected (credit investor and newsletter publisher Marc Faber for that one).
Market-related predictions have become a quadrennial tradition, but that doesn’t mean that they’re worth the ink that’s spilled on them. In terms of broader trends, politics in general—and elections in particular—have minimal predictive value with respect to subsequent market (and economic) activity. Nonetheless, we’ll take some time to consider what both the historical—and the more recent—data might be telling us about this year’s election.
The historical data
As a general rule, the impact of presidential elections on market outcomes is statistically weak and unreliable. In large part, the issue is one of small sample sizes—since there is only one election every four years, we only have a couple dozen useful data points to draw from, many of which are so old as to make extrapolation to the current environment problematic. Small sample sets are also famously vulnerable to one or two outlier events (the plunge leading into the 2008 election, for example).
Nevertheless, if you study a data set long enough, a few trends are bound to pop out. One of the most commonly cited effects is the “previous 3 months” phenomenon. Over the last 22 elections, the direction of the stock market in the 3 months leading up to the election has correctly “predicted” the winner 19 times—when the market is positive in the pre-election period, the incumbent party tends to hold on to the White House; when the market is negative, the incumbent party loses. The three exceptions occurred in 1956, 1968, and 1980—interestingly, all Republican wins.
Of course, that phenomenon says nothing about subsequent market returns—if anything, the effect suggests that the stock market impacts the election, and not the other way around. What happens, then, if we do attempt to study subsequent returns?
Since the 1952 presidential election (we’re studying only the time period for which S&P 500 data is most reliable), 10 out of 16 elections have included a sitting president; of those 10, the incumbent president won reelection 7 times. In the 6 elections without a sitting president, the incumbent party only held onto the White House once. That last fact alone makes drawing historical conclusions about the election’s impact on the stock market difficult, because one data point cannot be trusted to indicate a trend.
That said, in the 8 elections where the incumbent party kept the presidency (7 of which were reelections of sitting presidents), the 12 months following Election Day saw an average gain of 10.88% (per Yahoo! Finance data). But when the incumbent party lost, the market was essentially flat over the next 12 months, with an average return of -0.23%. That difference may or may not indicate a causal link, but it would lend credence to the theory that markets dislike uncertainty, and therefore perform best when there is a sense of continuity in the White House.
For what it’s worth, the one election in which the incumbent party held on to the presidency despite the absence of a sitting president (1988, George H.W. Bush over Michael Dukakis) saw one of the strongest subsequent rallies in our data set, with a 22.9% gain. That fact might get Clinton supporters excited, but remember, the predictive power of a single data point is minimal.
This year’s data
Amid a sea of semi-hysterical headlines, one recent piece has attracted extra attention. In the immediate aftermath of the first presidential debate, University of Michigan economist (and New York Times contributor) Justin Wolfers wrote that “Wall Street fears a Trump presidency,” predicting market losses of 10-12% in the event of a Trump victory.
As evidence, Wolfers studied minute-by-minute data of overnight futures markets compared to similar real-time data of betting odds on Trump’s election chances. As Trump’s odds of victory steadily declined from 35% to 30% over the course of the evening, futures markets trended higher, by about two-thirds of a percent. Because there was no other meaningful news during the debate time period (and because futures markets are typically calm during the evening hours), Wolfers ascribed the entire market reaction to the debate, and extrapolated the market’s broader feelings about the candidates from there.
Unfortunately for Wolfers, this effect is not supported by data over any other relevant time frame. As Trump’s odds of victory steadily increased throughout July, the market also climbed. And rather than sparking a broader rally, Clinton’s debate “victory” has been followed by mostly sideways trading, even as her election victory odds have spiked. Since June, Trump’s election odds actually reveal a slight positive correlation with the S&P 500 (higher Trump odds equal higher stock prices), but the statistical link is incredibly weak. By any fair definition, there is no relationship between election odds and market activity, regardless of what two hours of data might suggest.
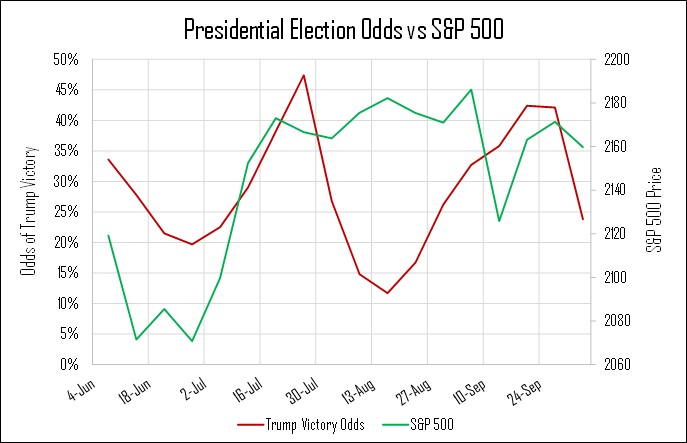
Source: Yahoo! Finance, PredictIt
The data notwithstanding, many voters remain convinced that the election outcome is pivotal—a recent CNBC poll found that 53% of those surveyed thought Clinton would be better for markets than Trump, while 26% thought Trump would yield higher returns (the remaining 21% were either neutral or had no opinion). Ultimately, we can slice and dice the data any number of ways and reach a variety of different (and likely contradictory) conclusions about how the election might impact markets. But recent experience suggests that the market has a tendency to overreact to political news, both in magnitude and velocity.
In the final analysis, we think it’s always best to leave politics out of your investment approach. At Cypress, we help clients to build diversified portfolios that are designed to hold up well in a wide variety of environments, and that are nimble and flexible enough to take advantage of any potential opportunities. We don’t know how this election will turn out, nor do we know with any certainty how the market will respond. What we do know is that having a coherent plan in place (and sticking to it) yields positive risk-adjusted returns over the long run.